
In this lesson, we will be discussing how to use pandas' powerful groupby feature.
What is the Pandas groupby Feature?
Pandas comes with a built-in groupby feature that allows you to group together rows based off of a column and perform an aggregate function on them. For example, you could calculate the sum of all rows that have a value of 1 in the column ID.
For anyone familiar with the SQL language for querying databases, the pandas groupby method is very similar to a SQL groupby statement.
It is easiest to understand the pandas groupby method using an example. We will be using the following DataFrame:
df = pd.DataFrame([ ['Google', 'Sam', 200],

                    ['Google', 'Charlie', 120],

                    ['Salesforce','Ralph', 125],

                    ['Salesforce','Emily', 250],

                    ['Adobe','Rosalynn', 150],

                    ['Adobe','Chelsea', 500]])

df.columns = ['Organization', 'Salesperson Name', 'Sales']

df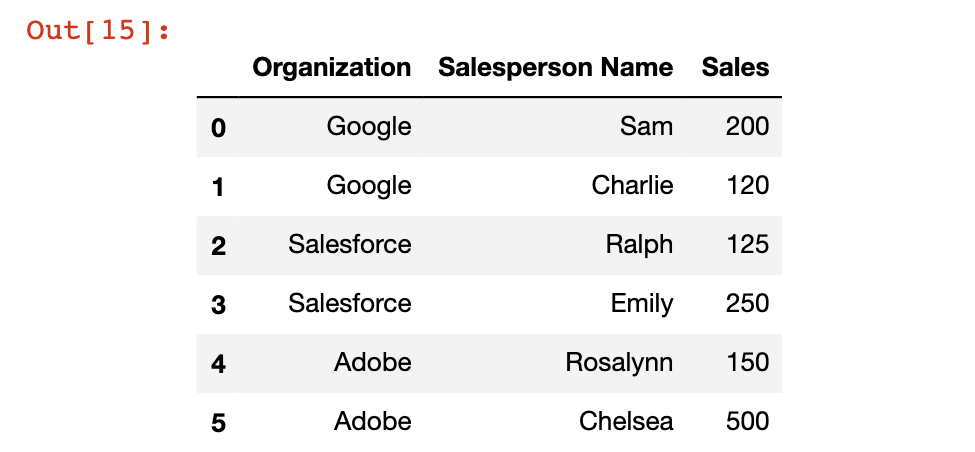
This DataFrame contains sales information for three separate organizations: Google, Salesforce, and Adobe. We will use the groupby method to get summary sales data for each specific organization.
To start, we will need to create a groupby object. This is a data structure that tells Python which column you'd like to group the DataFrame by. In our case, it is the Organization column, so we create a groupby object like this:
df.groupby('Organization')If you see an output that looks like this, you will know that you have created the object successfully:
<pandas.core.groupby.generic.DataFrameGroupBy object at 0x113f4ecd0>Once the groupby object has been created, you can call operations on that object to create a DataFrame with summary information on the Organization groups. A few examples are below:
df.groupby('Organization').mean()

#The mean (or average) of the sales column

df.groupby('Organization').sum()

#The sum of the sales column

df.groupby('Organization').std()

#The standard deviation of the sales column
Note that since all of the operations above are numerical, they will automatically ignore the Salesperson Name column, because it only contains strings.
Here are a few other aggregate functions that work well with pandas' groupby method:
df.groupby('Organization').count()

#Counts the number of observations

df.groupby('Organization').max()

#Returns the maximum value

df.groupby('Organization').min()

#Returns the minimum value
Using groupby With The describe Method
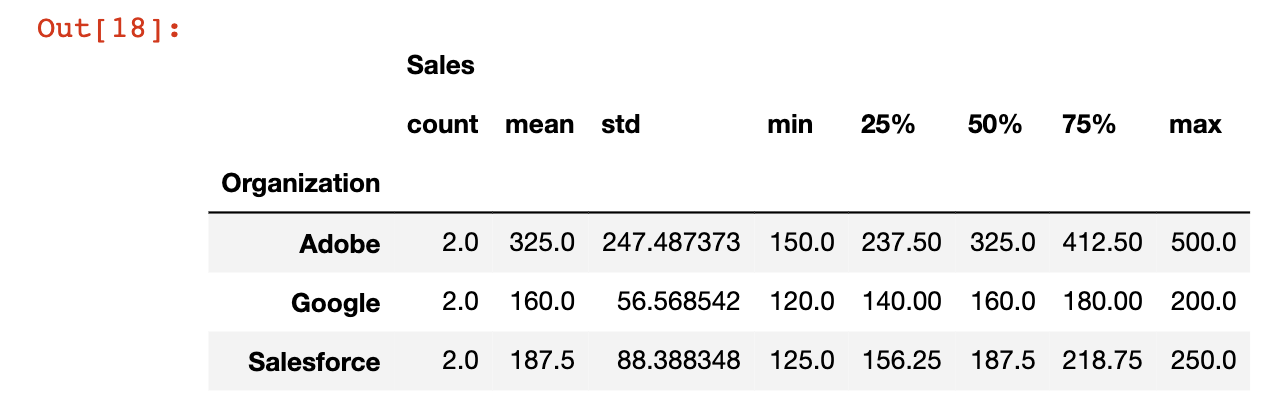
One very useful tool when working with pandas DataFrames is the describe method, which returns useful information for every category that the groupby function is working with.
This is best learned through an example. I've combined the groupby and describe methods below:
df.groupby('Organization').describe()Here is what the output looks like:
Moving On
This lesson introduced you to the groupby method available to pandas DataFrames. After working through some practice problems, we will learn about more methods and operations that we can use to work with this important pandas data structure.