
When learning about NumPy, we learned that we can work with both one-dimensional NumPy arrays (sometimes called vectors) and two-dimensional NumPy arrays (sometimes called matrices). We explored pandas Series in the last lesson, which are similar to one-dimensional NumPy arrays.
In this lesson, we will dive into pandas DataFrames, which are similar to two-dimensional NumPy arrays - but with much more functionality. DataFrames are the most important data structure in the pandas library, so pay close attention throughout this lesson.
What Is A Pandas DataFrame?
A pandas DataFrame is a two-dimensional data structure that has labels for both its rows and columns. For those familiar with Microsoft Excel, Google Sheets, or other spreadsheet software, DataFrames are very similar.
Here is an example of a pandas DataFrame being displayed within a Jupyter Notebook.
We will now go through the process of recreating this DataFrame step-by-step.
First, you'll need to import both the NumPy and pandas libraries. We have done this before, but in case you're unsure, here's another example of how to do that:
import numpy as np

import pandas as pd
We'll also need to create lists for the row and column names. We can do this using vanilla Python lists:
rows = ['X','Y','Z']

cols = ['A', 'B', 'C', 'D', 'E']
Next, we will need to create a NumPy array that holds the data contained within the cells of the DataFrame. I used NumPy's np.random.randn method for this. I also wrapped that method in the np.round method (with a second argument of 2), which rounds each data point to 2 decimal places and makes the data structure much easier to read.
Here's the final function that generated the data.
data = np.round(np.random.randn(3,5),2)Once this is done, you can wrap all of the constituent variables in the pd.DataFrame method to create your first DataFrame!
pd.DataFrame(data, rows, cols)There is a lot to unpack here, so let's discuss this example in a bit more detail.
First, it is not necessary to create each variable outside of the DataFrame itself. You could have created this DataFrame in one line like this:
pd.DataFrame(np.round(np.random.randn(3,5),2), ['X','Y','Z'], ['A', 'B', 'C', 'D', 'E'])With that said, declaring each variable separately makes the code much easier to read.
Second, you might be wondering if it is necessary to put rows into the DataFrame method before columns. It is indeed necessary. If you tried running pd.DataFrame(data, cols, rows), your Jupyter Notebook would generate the following error message:
ValueError: Shape of passed values is (3, 5), indices imply (5, 3)Next, we will explore the relationship between pandas Series and pandas DataFrames.
The Relationship Between Pandas Series and Pandas DataFrame
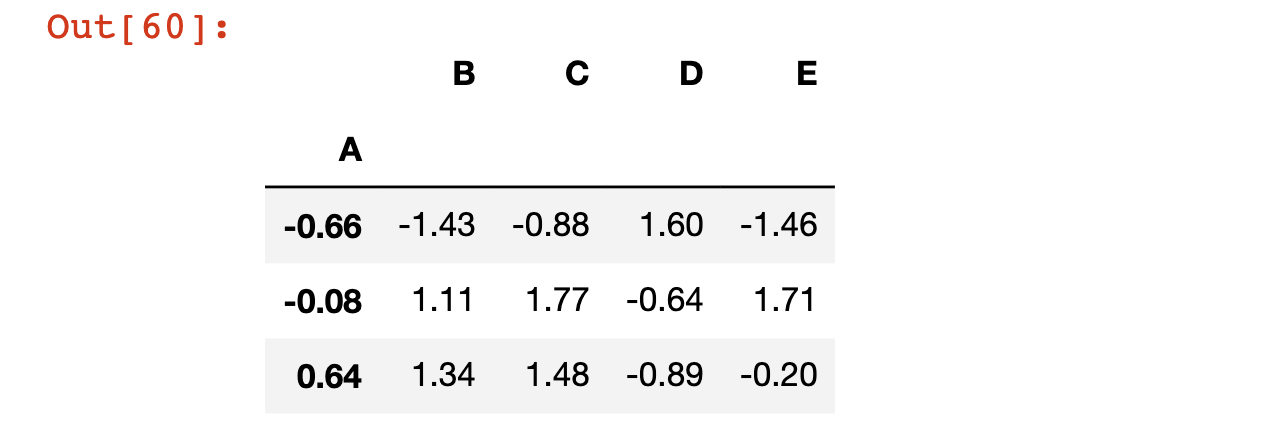
Let's take another look at the pandas DataFrame that we just created:
If you had to verbally describe a pandas Series, one way to do so might be "a set of labeled columns containing data where each column shares the same set of row index."
Interestingly enough, each of these columns is actually a pandas Series! So we can modify our definition of the pandas DataFrame to match its formal definition:
"A set of pandas Series that shares the same index."
Indexing and Assignment in Pandas DataFrames
We can actually call a specific Series from a pandas DataFrame using square brackets, just like how we call a element from a list. A few examples are below:
df = pd.DataFrame(data, rows, cols)
df['A']
"""
Returns:
X -0.66
Y -0.08
Z 0.64
Name: A, dtype: float64
"""
df['E']
"""
Returns:
X -1.46
Y 1.71
Z -0.20
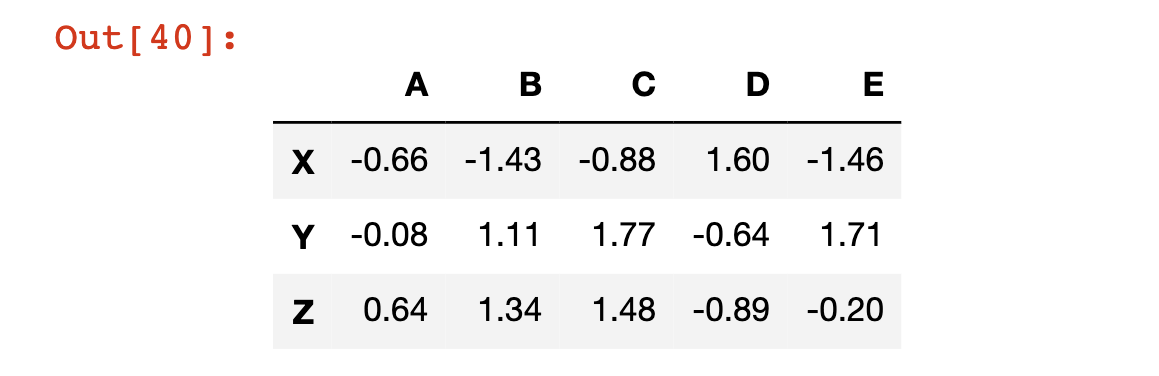
Name: E, dtype: float64
"""What if you wanted to select multiple columns from a pandas DataFrame? You can pass in a list of columns, either directly in the square brackets - such as df[['A', 'E']] - or by declaring the variable outside of the square brackets like this:
columnsIWant = ['A', 'E']

df[columnsIWant]

#Returns the DataFrame, but only with columns A and E
You can also select a specific element of a specific row using chained square brackets. For example, if you wanted the element contained in row A at index X (which is the element in the top left cell of the DataFrame) you could access it with df['A']['X'].
A few other examples are below.
df['B']['Z']

#Returns 1.34

df['D']['Y']

#Returns -0.64
How To Create and Remove Columns in a Pandas DataFrame
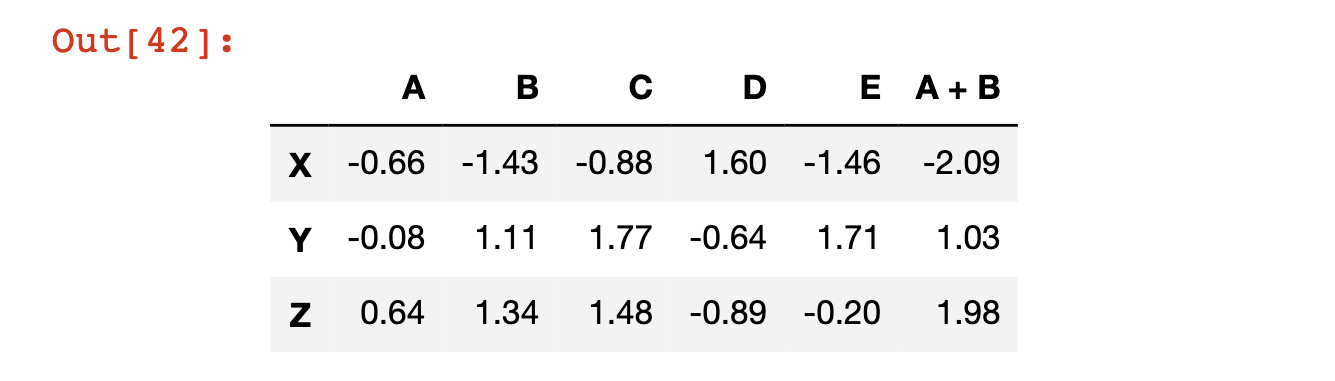
You can create a new column in a pandas DataFrame by specifying the column as though it already exists, and then assigning it a new pandas Series.
As an example, in the following code block we create a new column called 'A + B' which is the sum of columns A and B:
df['A + B'] = df['A'] + df['B']

df

#The last line prints out the new DataFrame
Here's the output of that code block:
To remove this column from the pandas DataFrame, we need to use the pd.DataFrame.drop method.
Note that this method defaults to dropping rows, not columns. To switch the method settings to operate on columns, we must pass it in the axis=1 argument.
df.drop('A + B', axis = 1)
It is very important to note that this drop method does not actually modify the DataFrame itself. For evidence of this, print out the df variable again, and notice how it still has the A + B column:
df
The reason that drop (and many other DataFrame methods!) do not modify the data structure by default is to prevent you from accidentally deleting data.
There are two ways to make pandas automatically overwrite the current DataFrame.
The first is by passing in the argument inplace=True, like this:
df.drop('A + B', axis=1, inplace=True)The second is by using an assignment operator that manually overwrites the existing variable, like this:
df = df.drop('A + B', axis=1)Both options are valid but I find myself using the second option more frequently because it is easier to remember.
The drop method can also be used to drop rows. For example, we can remove the row Z as follows:
df.drop('Z')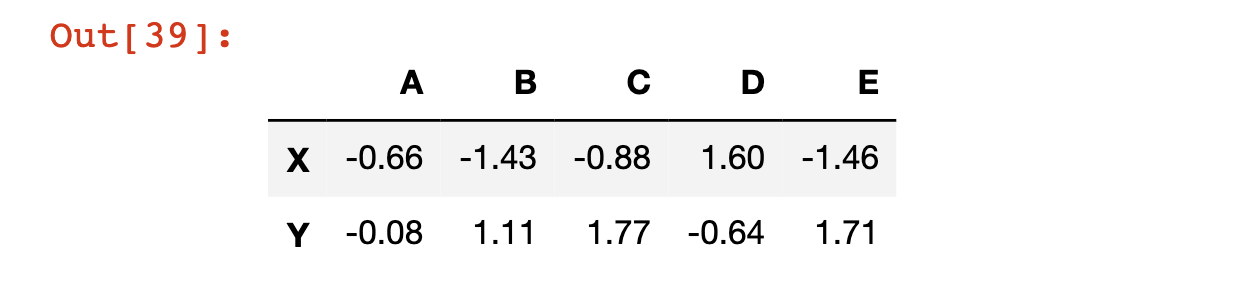
How To Select A Row From A Pandas DataFrame
We have already seen that we can access a specific column of a pandas DataFrame using square brackets. We will now see how to access a specific row of a pandas DataFrame, with the similar goal of generating a pandas Series from the larger data structure.
DataFrame rows can be accessed by their row label using the loc attribute along with square brackets. An example is below.
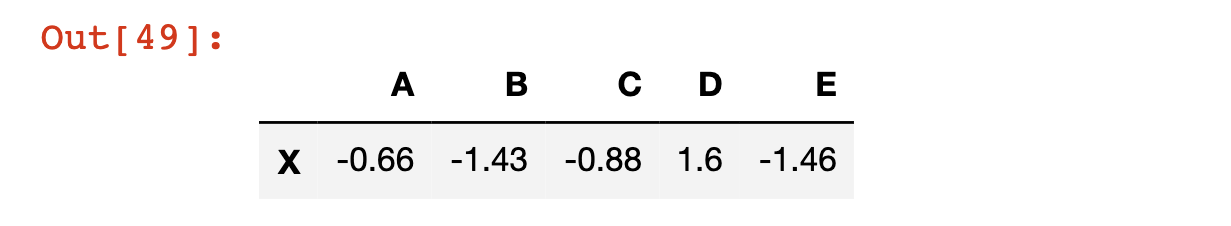
df.loc['X']Here is the output of that code:
A   -0.66

B   -1.43

C   -0.88

D    1.60

E   -1.46

Name: X, dtype: float64
DataFrame rows can be accessed by their numerical index using the iloc attribute along with square brackets. An example is below.
df.iloc[0]As you would expect, this code has the same output as our last example:
A   -0.66

B   -1.43

C   -0.88

D    1.60

E   -1.46

Name: X, dtype: float64
How To Determine The Number Of Rows and Columns in a Pandas DataFrame
There are many cases where you'll want to know the shape of a pandas DataFrame. By shape, I am referring to the number of columns and rows in the data structure.
Pandas has a built-in attribute called shape that allows us to easily access this:
df.shape

#Returns (3, 5)
Slicing Pandas DataFrames
We have already seen how to select rows, columns, and elements from a pandas DataFrame. In this section, we will explore how to select a subset of a DataFrame. Specifically, let's select the elements from columns A and B and rows X and Y.
We can actually approach this in a step-by-step fashion. First, let's select columns A and B:
df[['A', 'B']]Then, let's select rows X and Y:
df[['A', 'B']].loc[['X', 'Y']]And we're done!
Conditional Selection Using Pandas DataFrame
If you recall from our discussion of NumPy arrays, we were able to select certain elements of the array using conditional operators. For example, if we had a NumPy array called arr and we only wanted the values of the array that were larger than 4, we could use the command arr[arr > 4].
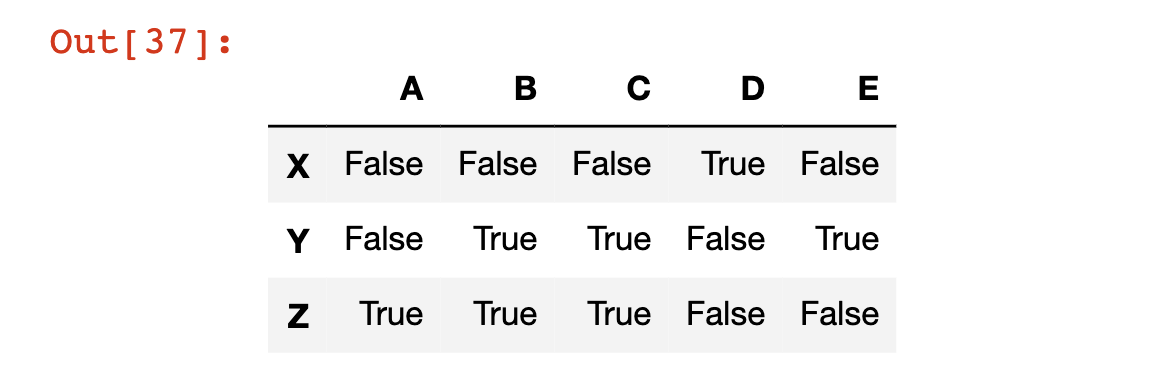
Pandas DataFrames follow a similar syntax. For example, if we wanted to know where our DataFrame has values that were greater than 0.5, we could type df > 0.5 to get the following output:
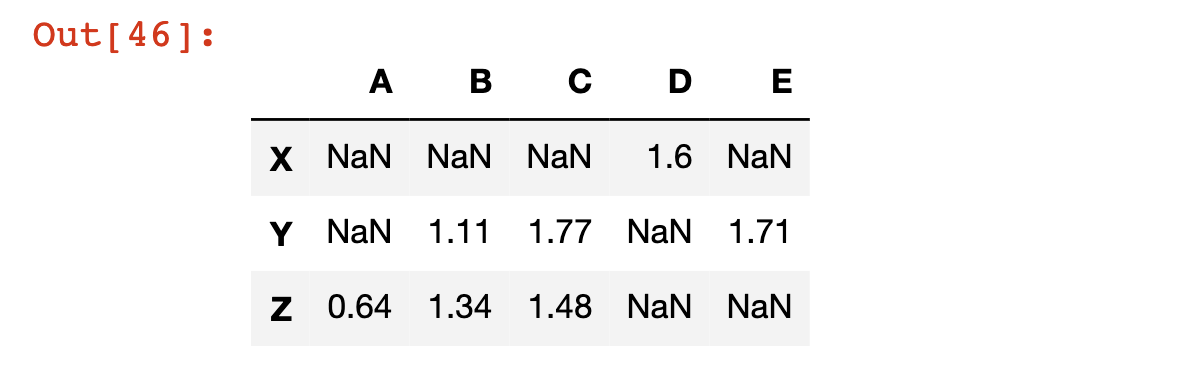
We can also generate a new pandas DataFrame that contains the normal values where the statement is True, and NaN - which stands for Not a Number - values where the statement is false. We do this by passing the statement into the DataFrame using square brackets, like this:
df[df > 0.5]Here is the output of that code:
You can also use conditional selection to return a subset of the DataFrame where a specific condition is satisfied in a specified column.
To be more specific, let's say that you wanted the subset of the DataFrame where the value in column C was less than 1. This is only true for row X.
You can get an array of the boolean values associated with this statement like this:
df['C'] < 1Here's the output:
X     True

Y    False

Z    False

Name: C, dtype: bool
You can also get the DataFrame's actual values relative to this conditional selection command by typing df[df['C'] < 1], which outputs just the first row of the DataFrame (since this is the only row where the statement is true for column C:
You can also chain together multiple conditions while using conditional selection. We do this using pandas' & operator. You cannot use Python's normal and operator, because in this case we are not comparing two boolean values. Instead, we are comparing two pandas Series that contain boolean values, which is why the & character is used instead.
As an example of multiple conditional selection, you can return the DataFrame subset that satisfies df['C'] > 0 and df['A']> 0 with the following code:
df[(df['C'] > 0) & (df['A']> 0)]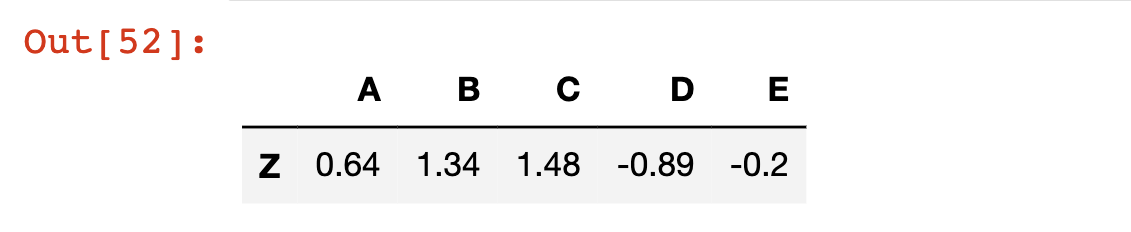
How To Modify The Index of a Pandas DataFrame
There are a number of ways that you can modify the index of a pandas DataFrame.
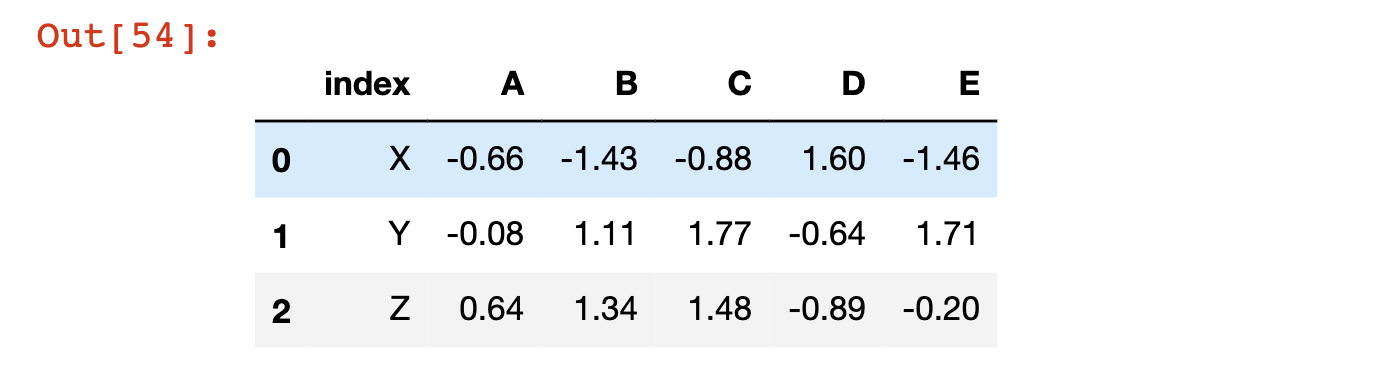
The most basic is to reset the index to its default numerical values. We do this using the reset_index method:
df.reset_index()Note that this creates a new column in the DataFrame called index that contains the previous index labels:
Note that like the other DataFrame operations that we have explored, reset_index does not modify the original DataFrame unless you either (1) force it to using the = assignment operator or (2) specify inplace=True.
You can also set an existing column as the index of the DataFrame using the set_index method. We can set column A as the index of the DataFrame using the following code:
df.set_index('A')The values of A are now in the index of the DataFrame:
There are three things worth noting here:
set_indexdoes not modify the original DataFrame unless you either (1) force it to using the=assignment operator or (2) specifyinplace=True.- Unless you run
reset_indexfirst, performing aset_indexoperation withinplace=Trueor a forced=assignment operator will permanently overwrite your current index values. - If you want to rename your index to labels that are not currently contained in a column, you can do so by (1) creating a NumPy array with those values, (2) adding those values as a new row of the pandas DataFrame, and (3) running the
set_indexoperation.
How To Rename Columns in a Pandas DataFrame
The last DataFrame operation we'll discuss is how to rename their columns.
Columns are an attribute of a pandas DataFrame, which means we can call them and modify them using a simple dot operator. For example:
df.columns

#Returns Index(['A', 'B', 'C', 'D', 'E'], dtype='object'
The assignment operator is the best way to modify this attribute:
df.columns = [1, 2, 3, 4, 5]

df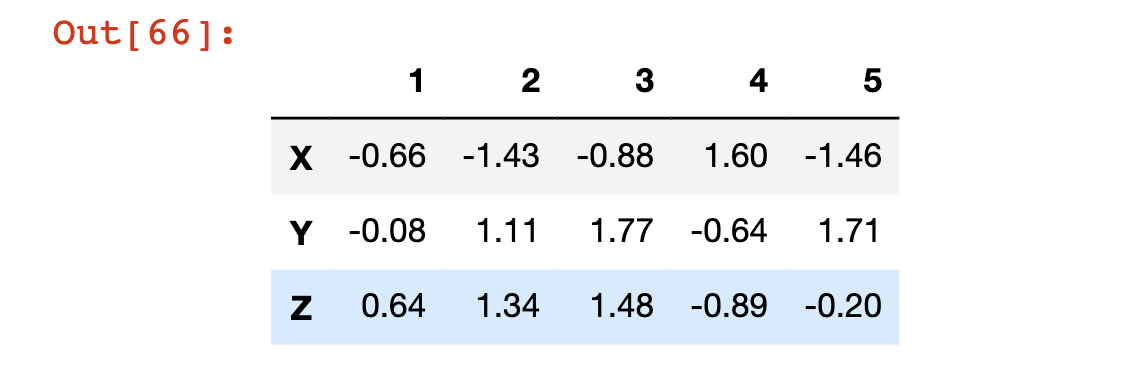
Moving On
In this lesson, I presented a thorough overview of pandas DataFrames. I know that we covered a lot of material in this lesson, so the practice problems presented in the next section are more thorough than normal. Enjoy!