
In this tutorial, you will learn the best tools for debugging JavaScript code.
JavaScript Console Methods
The most basic debugging tools are console methods. These are methods that can be called from the console method.
The most commonly-used console method in JavaScript is console.log. We have already seen how console.log can be used to print text to the console of our web browsers.
However, JavaScript contains many other console methods. Let's discuss these other methods one-by-one.
The JavaScript console.info Method
Along with console.log, console.info is one of the most commonly-used debugging tools in JavaScript. You will notice that if you test out the console.info method in Google Chrome, it has the exact same functionality as console.log.
So why does console.info exist?
Well, console.info does have slightly different functionality - but _only _in the Firefox web browser. In Firefox, console.info will print with
The JavaScript console.error Method
The console.error method is another way that developers can print a method with a different appearance to the console. Said differently, console.error is similar to console.log but it has the following appearance:
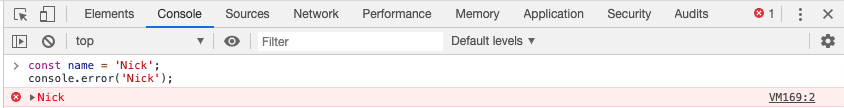
You can embed the console.error method within larger JavaScript applications to print clearly-visible warning for outside web developers.
For example, you could do the following:
If (person.money === 0){

	console.error(`${person.name} is out of money!`}

}
The JavaScript console.warn Method
In JavaScript, the console.warn method is almost identical to the console.error method. It just has a slightly different appearance.
An example is below:
The JavaScript console.table Method
Web developers often deal with tabular data - which is fancy terminology that simply means two-dimensional data that can fit nicely into rows and columns.
As an example, consider this large data set that contains information about individuals within a company:
const dataSet = [

    [ "Tiger Nixon", "System Architect", "Edinburgh", "5421", "2011/04/25", "$320,800" ],

    [ "Garrett Winters", "Accountant", "Tokyo", "8422", "2011/07/25", "$170,750" ],

    [ "Ashton Cox", "Junior Technical Author", "San Francisco", "1562", "2009/01/12", "$86,000" ],

    [ "Cedric Kelly", "Senior Javascript Developer", "Edinburgh", "6224", "2012/03/29", "$433,060" ],

    [ "Airi Satou", "Accountant", "Tokyo", "5407", "2008/11/28", "$162,700" ],

    [ "Brielle Williamson", "Integration Specialist", "New York", "4804", "2012/12/02", "$372,000" ],

    [ "Herrod Chandler", "Sales Assistant", "San Francisco", "9608", "2012/08/06", "$137,500" ],

    [ "Rhona Davidson", "Integration Specialist", "Tokyo", "6200", "2010/10/14", "$327,900" ],

    [ "Colleen Hurst", "Javascript Developer", "San Francisco", "2360", "2009/09/15", "$205,500" ],

    [ "Sonya Frost", "Software Engineer", "Edinburgh", "1667", "2008/12/13", "$103,600" ],

    [ "Jena Gaines", "Office Manager", "London", "3814", "2008/12/19", "$90,560" ],

    [ "Quinn Flynn", "Support Lead", "Edinburgh", "9497", "2013/03/03", "$342,000" ],

    [ "Charde Marshall", "Regional Director", "San Francisco", "6741", "2008/10/16", "$470,600" ],

    [ "Haley Kennedy", "Senior Marketing Designer", "London", "3597", "2012/12/18", "$313,500" ],

    [ "Tatyana Fitzpatrick", "Regional Director", "London", "1965", "2010/03/17", "$385,750" ],

    [ "Michael Silva", "Marketing Designer", "London", "1581", "2012/11/27", "$198,500" ],

    [ "Paul Byrd", "Chief Financial Officer (CFO)", "New York", "3059", "2010/06/09", "$725,000" ],

    [ "Gloria Little", "Systems Administrator", "New York", "1721", "2009/04/10", "$237,500" ],

    [ "Bradley Greer", "Software Engineer", "London", "2558", "2012/10/13", "$132,000" ],

    [ "Dai Rios", "Personnel Lead", "Edinburgh", "2290", "2012/09/26", "$217,500" ],

    [ "Jenette Caldwell", "Development Lead", "New York", "1937", "2011/09/03", "$345,000" ],

    [ "Yuri Berry", "Chief Marketing Officer (CMO)", "New York", "6154", "2009/06/25", "$675,000" ],

    [ "Caesar Vance", "Pre-Sales Support", "New York", "8330", "2011/12/12", "$106,450" ],

    [ "Doris Wilder", "Sales Assistant", "Sydney", "3023", "2010/09/20", "$85,600" ],

    [ "Angelica Ramos", "Chief Executive Officer (CEO)", "London", "5797", "2009/10/09", "$1,200,000" ],

    [ "Gavin Joyce", "Developer", "Edinburgh", "8822", "2010/12/22", "$92,575" ],

    [ "Jennifer Chang", "Regional Director", "Singapore", "9239", "2010/11/14", "$357,650" ],

    [ "Brenden Wagner", "Software Engineer", "San Francisco", "1314", "2011/06/07", "$206,850" ],

    [ "Fiona Green", "Chief Operating Officer (COO)", "San Francisco", "2947", "2010/03/11", "$850,000" ],

    [ "Shou Itou", "Regional Marketing", "Tokyo", "8899", "2011/08/14", "$163,000" ],

    [ "Michelle House", "Integration Specialist", "Sydney", "2769", "2011/06/02", "$95,400" ],

    [ "Suki Burks", "Developer", "London", "6832", "2009/10/22", "$114,500" ],

    [ "Prescott Bartlett", "Technical Author", "London", "3606", "2011/05/07", "$145,000" ],

    [ "Gavin Cortez", "Team Leader", "San Francisco", "2860", "2008/10/26", "$235,500" ],

    [ "Martena Mccray", "Post-Sales support", "Edinburgh", "8240", "2011/03/09", "$324,050" ],

    [ "Unity Butler", "Marketing Designer", "San Francisco", "5384", "2009/12/09", "$85,675" ]

];
If you want to print this data into a nicely-formatted output within a web browser, you can't simply use the console.log method:
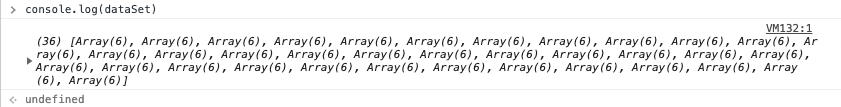
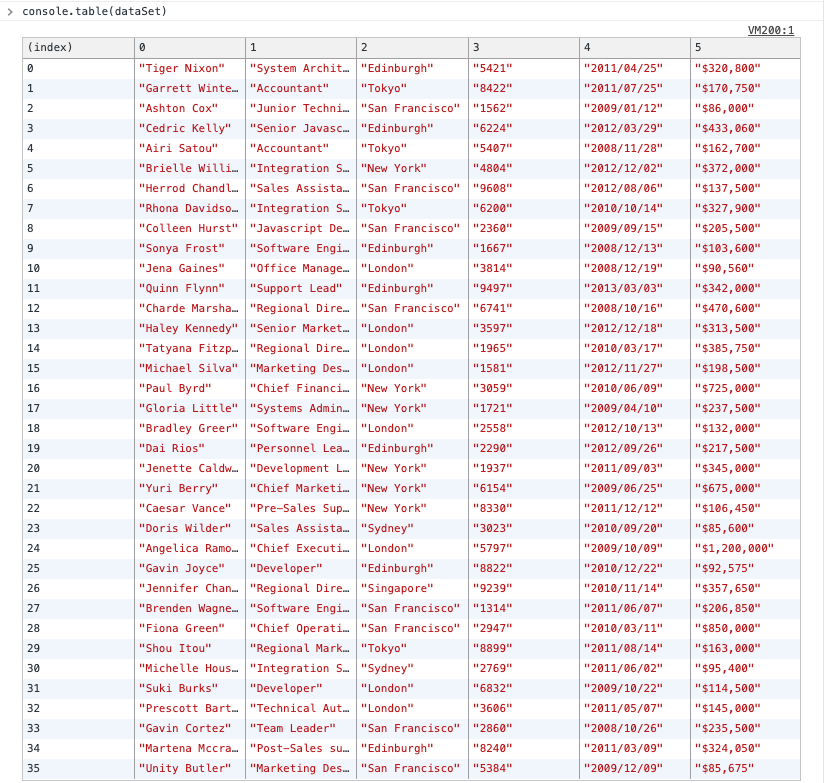
This is what console.table exists to solve.You can view an example of how to print tabular data with the console.table method below.
The JavaScript console.count Method
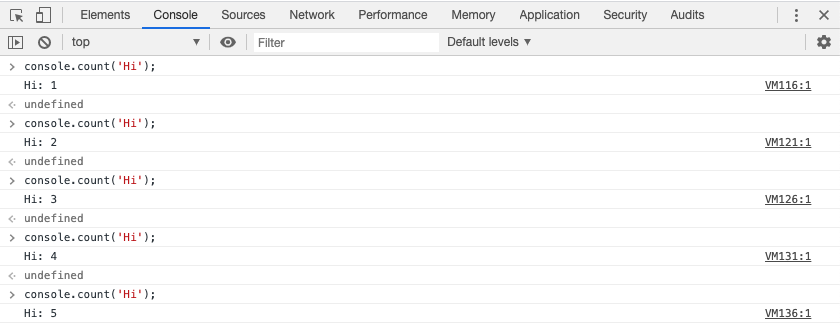
The JavaScript console.count method can be used to count the number of times that a specific string is passed into it. Every time you pass a string into the console.count method, it will return a string with the format string: count.
Here's an example:
The JavaScript console.count method is also capable of counting separate strings independently.
Here is an example:
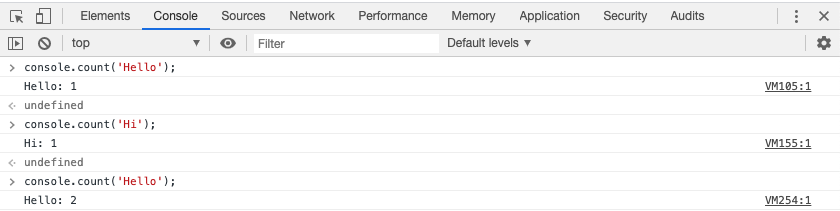
The console.count method is useful if you have a function or loop that is running more times than is intended.
The JavaScript console.group Method
The console.group method is an excellent way of grouping together multiple method calls from the console object.
The console.group command should be following by multiple other method calls, and the entire grouped statement should be completed with a call of the console.groupEnd method. Both the console.group and the console.groupEnd method need to accept the same argument - this tells JavaScript that they are referring to the same group of statements (which is necessary since you can actually nest different calls of the console.group method within each other).
This is fairly complicated, so let's see the console.group method in action. Here is how you could use the console.group method to print more than one message to the console of your web browser:
console.group('My group of statements');

console.log('My name is Nick');

console.warn('I like coding');

console.error('In fact, I teach people how to code on my website!');

console.groupEnd('My group of statements');
After this command is run, a nicely-formatted and collapsible group of statements will print to the console:
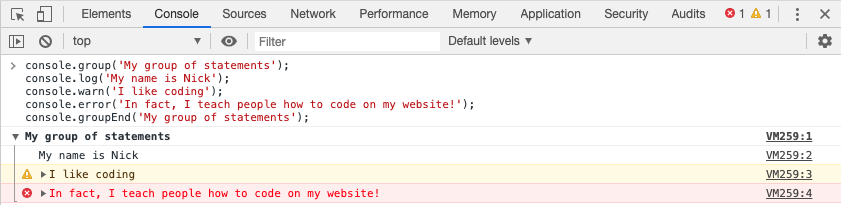
You can also changed the console.group method to a console.collapsed method so that the group of console statements prints as collapsed by default.
The JavaScript Callstack
The JavaScript callstack allows you to see what caused a specific function to run. Said differently, the callstack tells you "what function calls what function calls what functions…" - or the chain of function calls in a JavaScript application.
As an example, consider the following block of JavaScript code:
function misterize(name) {

  return `Mr. ${name}`;

}

function greet(name) {

  doesntExist();

  return `Hello ${name}`;

}

function go() {

  const name = misterize(greet('Nick'));

}
There are three JavaScript functions in this code block with various dependencies. Note that the greet function calls a function called doesntExist - which, as its name implies, does not exist. This will cause an error:
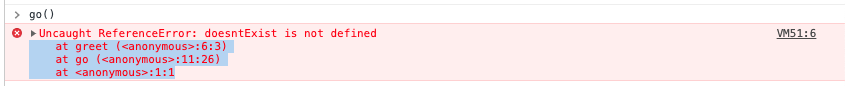
The highlighted text in this error message is the JavaScript callstack. The callstack tells you exactly where the error occurred, which makes it very powerful.
Let's break it down:
- The first line indicates that the error occurred in the
greetfunction - The second line indicates that the
greetfunction was called by thegofunction - The third line indicates that the
gofunction was called directly from the console (that's what thetag means)
While the callstack can be overwhelming for junior developers, it is unquestionably one of the most important parts of debugging code in JavaScript. Pay close attention to the callstack whenever your JavaScript returns an error.
How To Select Elements on a Page With the $ Character in JavaScript
In JavaScript, the $ character makes it very easy to select an HTML element on a page and then refer to that element in the console.
To do this, first open up your developer tools and select a specific HTML element. Then, move to your browser console. Typing $0 will print the last HTML element that you selected with your inspector tool!
You might be wondering what the 0 in $0 signifies. It simply refers to the last element that you selected in your developer tools. By a similar convention, $1 refers to the second-to-last element that you selected with your inspector.
To summarize, using the $0 selector in your console allows you to quickly refer back to HTML elements that you have previously selected in your developer tools.
JavaScript Breakpoints
In JavaScript, we can use the debugger keyword to pause JavaScript from running. This is called creating a breakpoint and allows you to pause your code to see the state of your JavaScript application at a specific point in time.
Here is an example of the JavaScript debugger keyword in action:
function debuggerExample(){

console.log('This is before the debugger keyword');

debugger;

console.log('This is after the debugger keyword');

}
Here's what happens when we run this code in our browser:

As you'd expect, the second console.log statement does not run.
Your developer tools may also redirect you to the Sources pane to show you exactly where the debugger statements exists in your code. This will look like this:

The Play button that I have circled will cause your JavaScript code to continue running past the breakpoint.
Importantly, the debugger keyword only affects your code when your developer tools are open. This means that it will not affect any code that is running on a live website, although you should definitely still be sure to remove the debugger keyword from any production applications.
How to View Network Requests From Your Developer Tools
Network requests are requests sent to an outside source asking for some piece of data. Websites use network requests to interact with external databases and render content to the page that you see.
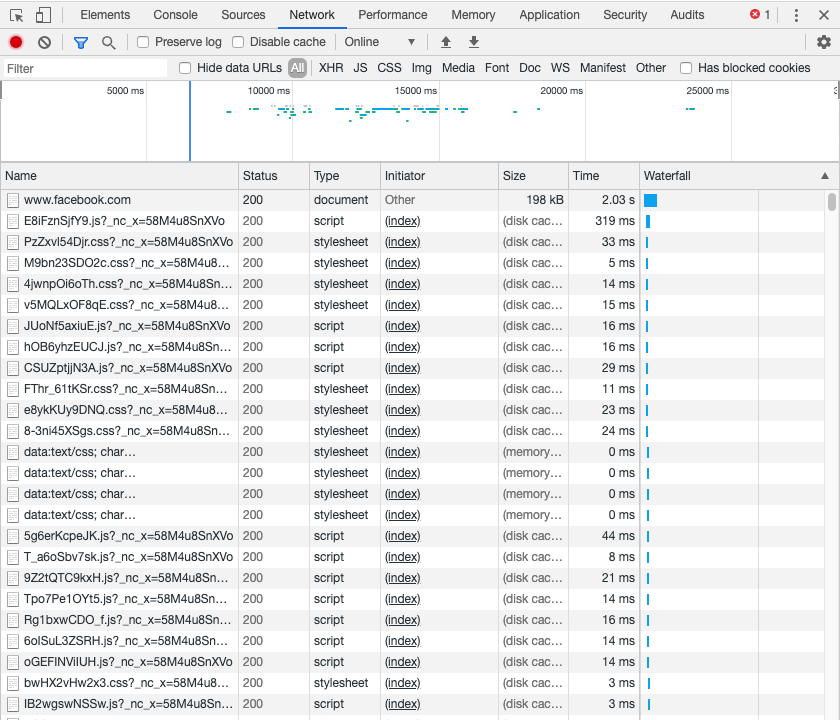
Take the Facebook website as an example. Facebook has databases that contain your friends lists, the posts that should appear in your news feed, your profile pictures, and millions of other data points. The Facebook website queries these databases using network requests (specifically, HTTP requests).
Network requests are also used to write data to the database. For example, a network request will inform the database when you send a new friend request.
Network requests are a possible source of bugs within a JavaScript program. Accordingly, it is important to understand how to view a website's network requests from your developer tools.
You can view a page's network requests from the Network tab of your developer tools. As an example, here are the network requests from my Facebook homepage:
Final Thoughts
In this tutorial, you learned the best developer tools for debugging code in JavaScript. Specifically, here is a summary of what we discussed:
-
JavaScript Console Methods
- The
console.infoMethod - The
console.errorMethod - The
console.warnMethod - The
console.tableMethod - The
console.countMethod - The
console.groupMethod
- The
- The JavaScript Callstack
- Selecting Elements on a Page With the
$Character - JavaScript breakpoints
- How to View Network Requests From Your Developer Tools
Over time, you will learn which developer tools are the most useful for your own personal style of JavaScript development.
To be honest, I use some of the tools from this tutorial much more than others.
It is still very important to cover all of them so you know the options available to you when you inevitably discover bugs within your JavaScript applications.