
The first type of machine learning model that we explored in this course was the linear regression model, which is useful for making numerical predictions based on groups of numerical variables.
In this tutorial, you will start learning about the logistic regression model, which is a close cousin of the linear regression model that is used to make classification predictions from a data set.
Table of Contents
You can skip to a specific section of this Python machine learning tutorial using the table of contents below:
- What is Logistic Regression?
- The Sigmoid Function
- Using Logistic Regression Models to Make Predictions
- Using a Confusion Matrix to Measure Logistic Regression Performance
- Final Thoughts
What is Logistic Regression?
Logistic regression is a machine learning model that is used to solve classification problems.
As a reminder, here are a few examples of machine learning classification problems:
- Spam emails (yes/no)
- Car insurance claims (writeoff/repair)
- Disease diagnosis
Each of the classification problems have exactly two categories, which makes them examples of binary classification problems.
Logistic regression is well-suited for solving binary classification problems - we simply assign the different categories a value of 0 and 1, respectively!
Logistic regression was invented because you can't use a linear regression model to make binary classification predictions. It will not lead to a good fit, since you're trying to fit a straight line through a dataset with only two possible values.
An image can help to understand why linear regression models are poorly suited for binary classification problems:
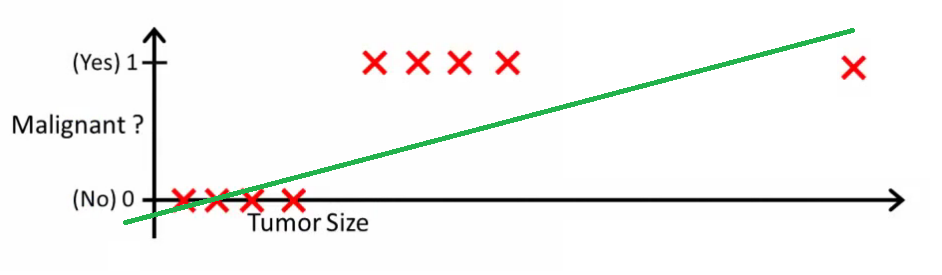
In this image, the y-axis represents the probability that the tumor is malignant. Conversely, the value 1-y represents the probability that the tumor is not malignant. As you can see, the linear regression model does a very poor job of predicting this probability for most of the observations in the data set.
This is why logistic regression models are useful. They have a bend to their line of best fit, which makes them much better-suited for predicting categorical data.
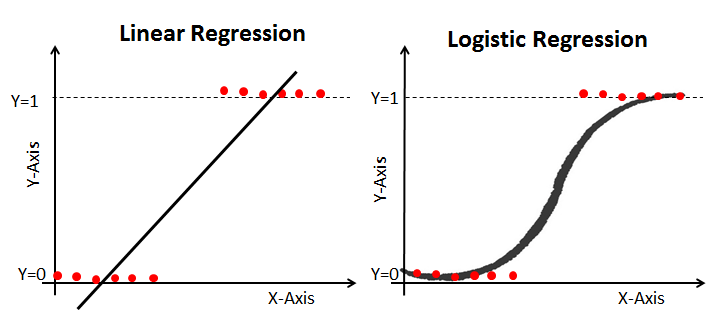
Here is an example that compares a linear regression model to a logistic regression model using the same training data:
The Sigmoid Function
The reason why the logistic regression model has a bend in its curve is because it is not calculated using a linear equation. Instead, logistic regression models are built using the Sigmoid Function (also called the Logistic Function because of its use in logistic regression).
You will not have to memorize the Sigmoid Function to be successful in this course. With that said, having some understanding of its appearance is useful. The equation is shown below:

The main characteristic of the Sigmoid Function worth understanding is that no matter what value you pass into it, it will always generate an output somewhere between 0 and 1.
Using Logistic Regression Models to Make Predictions
To use the linear regression model to make predictions, you generally need to specify a cutoff point. This cutoff point is typically 0.5.
Let's use our cancer diagnosis example to see this principle in practice. If the logistic regression model outputs a value below 0.5, then the data point is categorized as a non-malignant tumor. Similarly, if the Sigmoid Function outputs a value above 0.5, then the tumor would be classified as malignant.
Using a Confusion Matrix to Measure Logistic Regression Performance
Earlier in this course, we saw that a confusion matrix can be used as a tool to compare true positives, true negatives, false positives, and false negatives.
Confusion matrices are particularly useful when used to measure the performance of logistic regression models. Here is an example of how we could use a confusion matrix
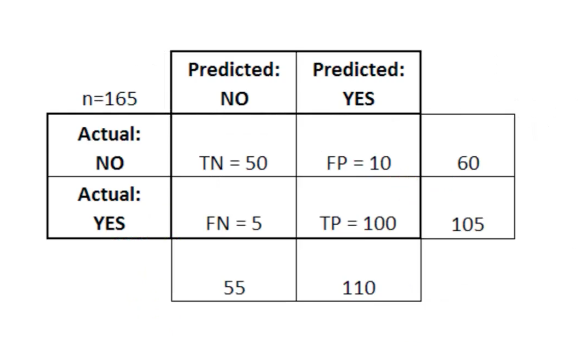
A confusion matrix is very useful for assessing whether your model is particularly weak in a specific quadrant of the confusion matrix. As an example, it might have an abnormally high number of false positives.
It can also be helpful in certain applications to make sure that your model performs well in an especially dangerous zone of the confusion matrix. In this example, for instance, you'd want to be very sure that you model does not have a very high rate of false negatives, as this would indicate that someone has a malignant tumor that you incorrectly classified as non-malignant.
Final Thoughts
In this tutorial, you had your first exposure to logistic regression machine learning models.
Here is a brief summary of what you learned in this tutorial:
- The types of classification problems that are suitable to be solved using logistic regression models
- That the logistic function (also called the Sigmoid Function) always outputs a value between 0 and 1
- How to use cutoff points to make predictions using a logistic regression machine learning model
- Why confusion matrices are useful to measure the performance of logistic regression models