
The K means clustering algorithm is typically the first unsupervised machine learning model that students will learn.
It allows machine learning practitioners to create groups of data points within a data set with similar quantitative characteristics. It is useful for solving problems like creating customer segments or identifying localities in a city with high crime rates.
In this tutorial, you will learn how to build your first K means clustering algorithm in Python.
Table of Contents
You can skip to a specific section of this Python K means clustering algorithm using the table of contents below:
- The Data Set We Will Use In This Tutorial
- The Imports We Will Use In This Tutorial
- Visualizing Our Data Set
- Building and Training Our K Means Clustering Model
- Making Predictions With Our K Means Clustering Model
- Visualizing the Accuracy of Our Model
- The Full Code For This Tutorial
- Final Thoughts
The Data Set We Will Use In This Tutorial
In this tutorial, we will be using a data set of data generated using scikit-learn.
Let's import scikit-learn's make_blobs function to create this artificial data. Open up a Jupyter Notebook and start your Python script with the following statement:
from sklearn.datasets import make_blobsNow let's use the make_blobs function to create some artificial data!
More specifically, here is how you could create a data set with 200 samples that has 2 features and 4 cluster centers. The standard deviation within each cluster will be set to 1.8.
raw_data = make_blobs(n_samples = 200, n_features = 2, centers = 4, cluster_std = 1.8)If you print this raw_data object, you'll notice that it is actually a Python tuple. The first element of this tuple is a NumPy array with 200 observations. Each observation contains 2 features (just like we specified with our make_blobs function!).
Now that our data has been created, we can move on to importing other important open-source libraries into our Python script.
The Imports We Will Use In This Tutorial
This tutorial will make use of a number of popular open-source Python libraries, including pandas, NumPy, and matplotlib. Let's continue our Python script by adding the following imports:
import pandas as pd

import numpy as np

import seaborn

import matplotlib.pyplot as plt

%matplotlib inline
The first group of imports in this code block is for manipulating large data sets. The second group of imports is for creating data visualizations.
Let's move on to visualizing our data set next.
Visualizing Our Data Set
In our make_blobs function, we specified for our data set to have 4 cluster centers. The best way to verify that this has been handled correctly is by creating some quick data visualizations.
To start, let's use the following command to plot all of the rows in the first column of our data set against all of the rows in the second column of our data set:
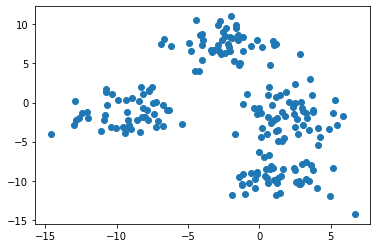
Note: your data set will appear differently than mine since this is randomly-generated data.
This image seems to indicate that our data set has only three clusters. This is because two of the clusters are very close to each other.
To fix this, we need to reference the second element of our raw_data tuple, which is a NumPy array that contains the cluster to which each observation belongs.
If we color our data set using each observation's cluster, the unique clusters will quickly become clear. Here is the code to do this:
plt.scatter(raw_data[0][:,0], raw_data[0][:,1], c=raw_data[1])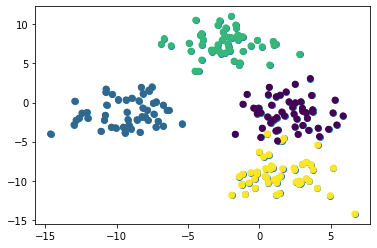
We can now see that our data set has four unique clusters. Let's move on to building our K means cluster model in Python!
Building and Training Our K Means Clustering Model
The first step to building our K means clustering algorithm is importing it from scikit-learn. To do this, add the following command to your Python script:
from sklearn.cluster import KMeansNext, lets create an instance of this KMeans class with a parameter of n_clusters=4 and assign it to the variable model:
model = KMeans(n_clusters=4)Now let's train our model by invoking the fit method on it and passing in the first element of our raw_data tuple:
model.fit(raw_data[0])In the next section, we'll explore how to make predictions with this K means clustering model.
Before moving on, I wanted to point out one difference that you may have noticed between the process for building this K means clustering algorithm (which is an unsupervised machine learning algorithm) and the supervised machine learning algorithms we've worked with so far in this course.
Namely, we did not have to split the data set into training data and test data. This is an important difference - and in fact, you never need to make the train/test split on a data set when building unsupervised machine learning models!
Making Predictions With Our K Means Clustering Model
Machine learning practitioners generally use K means clustering algorithms to make two types of predictions:
- Which cluster each data point belongs to
- Where the center of each cluster is
It is easy to generate these predictions now that our model has been trained.
First, let's predict which cluster each data point belongs to. To do this, access the labels_ attribute from our model object using the dot operator, like this:
model.labels_This generates a NumPy array with predictions for each data point that looks like this:
array([3, 2, 7, 0, 5, 1, 7, 7, 6, 1, 2, 4, 6, 7, 6, 4, 4, 3, 3, 6, 0, 0,

       6, 4, 5, 6, 0, 2, 6, 5, 4, 3, 4, 2, 6, 6, 6, 5, 6, 2, 1, 1, 3, 4,

       3, 5, 7, 1, 7, 5, 3, 6, 0, 3, 5, 5, 7, 1, 3, 1, 5, 7, 7, 0, 5, 7,

       3, 4, 0, 5, 6, 5, 1, 4, 6, 4, 5, 6, 7, 2, 2, 0, 4, 1, 1, 1, 6, 3,

       3, 7, 3, 6, 7, 7, 0, 3, 4, 3, 4, 0, 3, 5, 0, 3, 6, 4, 3, 3, 4, 6,

       1, 3, 0, 5, 4, 2, 7, 0, 2, 6, 4, 2, 1, 4, 7, 0, 3, 2, 6, 7, 5, 7,

       5, 4, 1, 7, 2, 4, 7, 7, 4, 6, 6, 3, 7, 6, 4, 5, 5, 5, 7, 0, 1, 1,

       0, 0, 2, 5, 0, 3, 2, 5, 1, 5, 6, 5, 1, 3, 5, 1, 2, 0, 4, 5, 6, 3,

       4, 4, 5, 6, 4, 4, 2, 1, 7, 4, 6, 6, 0, 6, 3, 5, 0, 5, 2, 4, 6, 0,

       1, 0], dtype=int32)
To see where the center of each cluster lies, access the cluster_centers_ attribute using the dot operator like this:
model.cluster_centers_This generates a two-dimensional NumPy array that contains the coordinates of each clusters center. It will look like this:
array([[ -8.06473328,  -0.42044783],

       [  0.15944397,  -9.4873621 ],

       [  1.49194628,   0.21216413],

       [-10.97238157,  -2.49017206],

       [  3.54673215,  -9.7433692 ],

       [ -3.41262049,   7.80784834],

       [  2.53980034,  -2.96376999],

       [ -0.4195847 ,   6.92561289]])
We'll assess the accuracy of these predictions in the next section.
Visualizing the Accuracy of Our Model
The last thing we'll do in this tutorial is visualize the accuracy of our model. You can use the following code to do this:
f, (ax1, ax2) = plt.subplots(1, 2, sharey=True,figsize=(10,6))

ax1.set_title('Our Model')

ax1.scatter(raw_data[0][:,0], raw_data[0][:,1],c=model.labels_)

ax2.set_title('Original Data')

ax2.scatter(raw_data[0][:,0], raw_data[0][:,1],c=raw_data[1])
This generates two different plots side-by-side where one plot shows the clusters according to the real data set and the other plot shows the clusters according to our model. Here is what the output looks like:
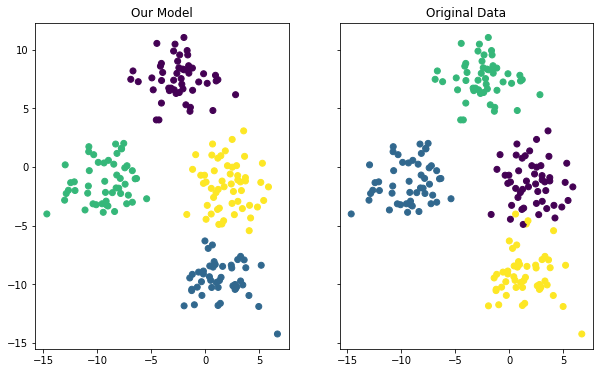
Although the coloring between the two plots is different, you can see that our model did a fairly good job of predicting the clusters within our data set. You can also see that the model was not perfect - if you look at the data points along a cluster's edge, you can see that it occasionally misclassified an observation from our data set.
There's one last thing that needs to be mentioned about measuring our model's prediction. In this example ,we knew which cluster each observation belonged to because we actually generated this data set ourselves.
This is highly unusual. K means clustering is more often applied when the clusters aren't known in advance. Instead, machine learning practitioners use K means clustering to find patterns that they don't already know within a data set.
The Full Code For This Tutorial
You can view the full code for this tutorial in this GitHub repository. It is also pasted below for your reference:
#Create artificial data set

from sklearn.datasets import make_blobs

raw_data = make_blobs(n_samples = 200, n_features = 2, centers = 4, cluster_std = 1.8)

#Data imports

import pandas as pd

import numpy as np

#Visualization imports

import seaborn

import matplotlib.pyplot as plt

%matplotlib inline

#Visualize the data

plt.scatter(raw_data[0][:,0], raw_data[0][:,1])

plt.scatter(raw_data[0][:,0], raw_data[0][:,1], c=raw_data[1])

#Build and train the model

from sklearn.cluster import KMeans

model = KMeans(n_clusters=4)

model.fit(raw_data[0])

#See the predictions

model.labels_

model.cluster_centers_

#PLot the predictions against the original data set

f, (ax1, ax2) = plt.subplots(1, 2, sharey=True,figsize=(10,6))

ax1.set_title('Our Model')

ax1.scatter(raw_data[0][:,0], raw_data[0][:,1],c=model.labels_)

ax2.set_title('Original Data')

ax2.scatter(raw_data[0][:,0], raw_data[0][:,1],c=raw_data[1])
Final Thoughts
In this tutorial, you built your first K means clustering algorithm in Python.
Here is a brief summary of what you learned:
- How to create artificial data in
scikit-learnusing themake_blobsfunction - How to build and train a K means clustering model
- That unsupervised machine learning techniques do not require you to split your data into training data and test data
- How to build and train a K means clustering model using
scikit-learn - How to visualizes the performance of a K means clustering algorithm when you know the clusters in advance