
In this lesson, we will briefly discuss the imports and configurations required throughout the rest of this course.
Setting Matplotlib Charts to Display Within Jupyter Notebooks
Every lesson in this course will assume that you have run the following code before creating any Python visualizations:
%matplotlib inlineYou probably have two questions:
- What is the meaning of the
%syntax? - What does this command do?
First, let's discuss the % syntax.
The % operator is used in iPython notebooks (of which the Jupyter Notebook is an example) to reference magic functions. These are special functions that only work in iPython notebooks (like Jupyter). Here is more information on magic functions from the iPython documentation:
"IPython has a set of predefined ‘magic functions’ that you can call with a command line style syntax. There are two kinds of magics, line-oriented and cell-oriented. Line magics are prefixed with the % character and work much like OS command-line calls: they get as an argument the rest of the line, where arguments are passed without parentheses or quotes. Lines magics can return results and can be used in the right hand side of an assignment. Cell magics are prefixed with a double %%, and they are functions that get as an argument not only the rest of the line, but also the lines below it in a separate argument."
So what is the purpose of %matplotlib inline command? Let's again refer to iPython's documentation:
"With this backend, the output of plotting commands is displayed inline within frontends like the Jupyter notebook, directly below the code cell that produced it. The resulting plots will then also be stored in the notebook document."
This means that the visualizations we produce will show directly in our Jupyter Notebook instead of opening in a separate window.
How To Import Matplotlib
Matplotlib has a variety of modules available for import. To begin this course, we will be using the pyplot module, which is typically imported under the alias plt.
The full command for importing this is below:
import matplotlib.pyplot as pltHow To Test That Matplotlib Has Installed Correctly
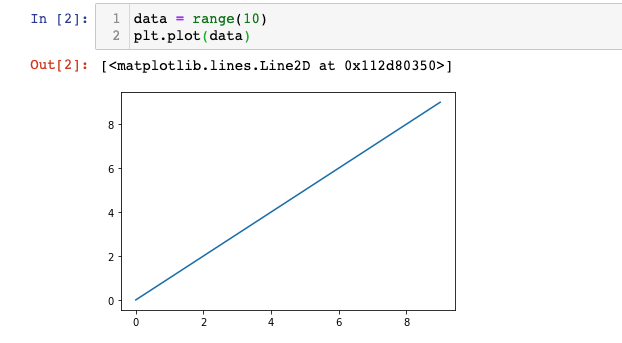
Let's test that matplotlib has been installed correctly by creating a very basic line plot. First, create a basic dataset with the range function:
data = range(10)Next, plot this data using pyplot's plot method:
plt.plot(data)If your output looks like this, then you can proceed!
A Note For Mac Users
If you are working through this course on a Mac that has a Retina display, you may notice that the chart we just created is pretty blurry.
IPython has a built-in solution for this. You can run the following code to change your Jupyter Notebook to 'Retina Mode', which significantly improves the resolution of your visualizations:
from IPython.display import set_matplotlib_formats
set_matplotlib_formats('retina')
Moving On
In this lesson, we learned how to import matplotlib's pyplot module and how to set visualizations to display within a Jupyter Notebook using %matplotlib inline. Let's move on to creating some real charts in the next section!